Blogging in RMarkdown in Jekyll - Revisited
SmarterPoland-package provides a straghtforward connection to Eurostat data. It is uninformatively described as:
A set of tools developed by the Foundation SmarterPoland.pl Tools for accessing and processing datasets presented on the blog SmarterPoland.pl.
But in real terms it has functionality only towards Eurostat. Here is a brief demo how you can search for material deprivation and then create a line plot at NUTS2 level.
Search
library(SmarterPoland)## Loading required package: reshape
## Loading required package: plyr
##
## Attaching package: 'reshape'
##
## The following objects are masked from 'package:plyr':
##
## rename, round_any
##
## Loading required package: rjsonsearchresults <- grepEurostatTOC("material deprivation")
df <- getEurostatRCV(kod = "ilc_mddd21")Plot at nuts2-level
# time variable into numerical
df$time <- as.numeric(levels(df$time))[df$time]
cname <- subset(df, time == 2011)

# plot
library(ggplot2)
ggplot(df, aes(x = time, y = value, color = geo, group = geo)) + geom_point() +
    geom_line() + geom_text(data = cname, aes(x = time, y = value, label = geo),
    hjust = -0.3) + theme(legend.position = "none") + labs(title = "material deprivation in EU at NUTS2-level",
    y = "population share (%)") + coord_cartesian(xlim = c(2003, 2012)) + scale_x_continuous(breaks = 2003:2011)
## Warning: Removed 834 rows containing missing values (geom_point).
## Warning: Removed 817 rows containing missing values (geom_path).
## Warning: Removed 14 rows containing missing values (geom_text).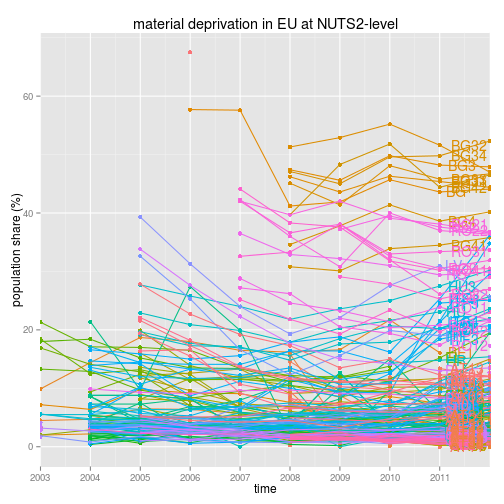
Plot at nuts1-level
# subset geo-names only lenght of 2 characters
df$geo <- as.character(df$geo)
df$geo.n <- nchar(df$geo)
df <- subset(df, geo.n < 3)

cname <- subset(df, time == 2011)

# plot
library(ggplot2)
ggplot(df, aes(x = time, y = value, color = geo, group = geo)) + geom_point() +
    geom_line() + geom_text(data = cname, aes(x = time, y = value, label = geo),
    hjust = -0.3) + theme(legend.position = "none") + labs(title = "material deprivation in EU at NUTS2-level",
    y = "population share (%)") + coord_cartesian(xlim = c(2003, 2012)) + scale_x_continuous(breaks = 2003:2011)
## Warning: Removed 99 rows containing missing values (geom_point).
## Warning: Removed 89 rows containing missing values (geom_path).
## Warning: Removed 1 rows containing missing values (geom_text).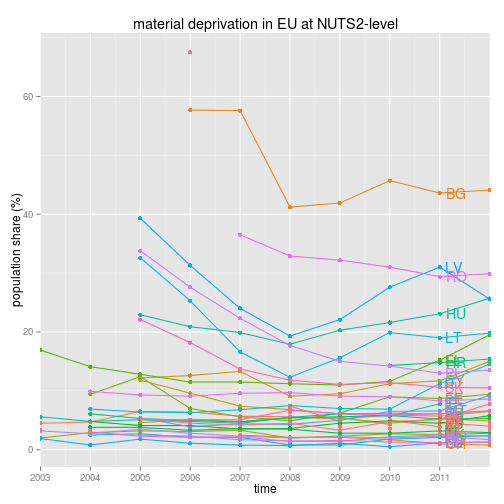
- Tagit:
- news (36)
